Chapter 4 Applications
4.1 Dimerization of FKBP12
4.1.1 Introduction
Myristoylated FKBP12 is known to dimerize upon addition of the dimerizing drug AP1510 (Amara et al. 1997). As a test application of exponential smoothing detrending (section 3.6) with automatically chosen parameter \(\tau\), we used this system with number and brightness to verify this dimerization. We tested this in 20 Cos7 cells with mClover-labelled FKBP12 (Nolan, Alvarez, et al. 2017).
4.1.2 Experimental results and discussion
We found a brightness increase in \(\epsilon\) of \(\approx 1.6\)-fold using the automatic detrending method. Assuming that the population was all monomers before ligand addition, the \(\approx 1.6\)-fold increase upon addition suggests that dimerization had occurred (see figure 4.1), however, we expected the increase to be \(\approx 2\)-fold upon dimerization. There could be many reasons for this discrepancy.
- FKBP is endogenously expressed in Cos7 cells, so depending on the level of native expression (not labelled) and the level of expression of our transfected FKBP (labelled), it could be that many cases of what is actually a dimer is behaving like a monomer because only one of the pair is labelled.
- Recently, a paper came out (Dunsing et al. 2018) explaining how the assumption that all fluorophores emit signal is invalid (because many never function properly) and that because of this, oligomeric state changes calculated from brightness must be adjusted by a correction factor specific to the fluorophore. Unfortunately, this study did not characterize mClover, so we do not know its correction factor to be able to apply it. Any such correction would bring us higher than 1.6.
It is possible that all of the above reasons are valid and are present to different degrees in different images. This could be a cause of the heterogeneity of fold-changes in \(\epsilon\) measured from single images. This heterogeneity means that many replicates are needed in number and brightness experiments in order to converge upon the true value of the fold change.
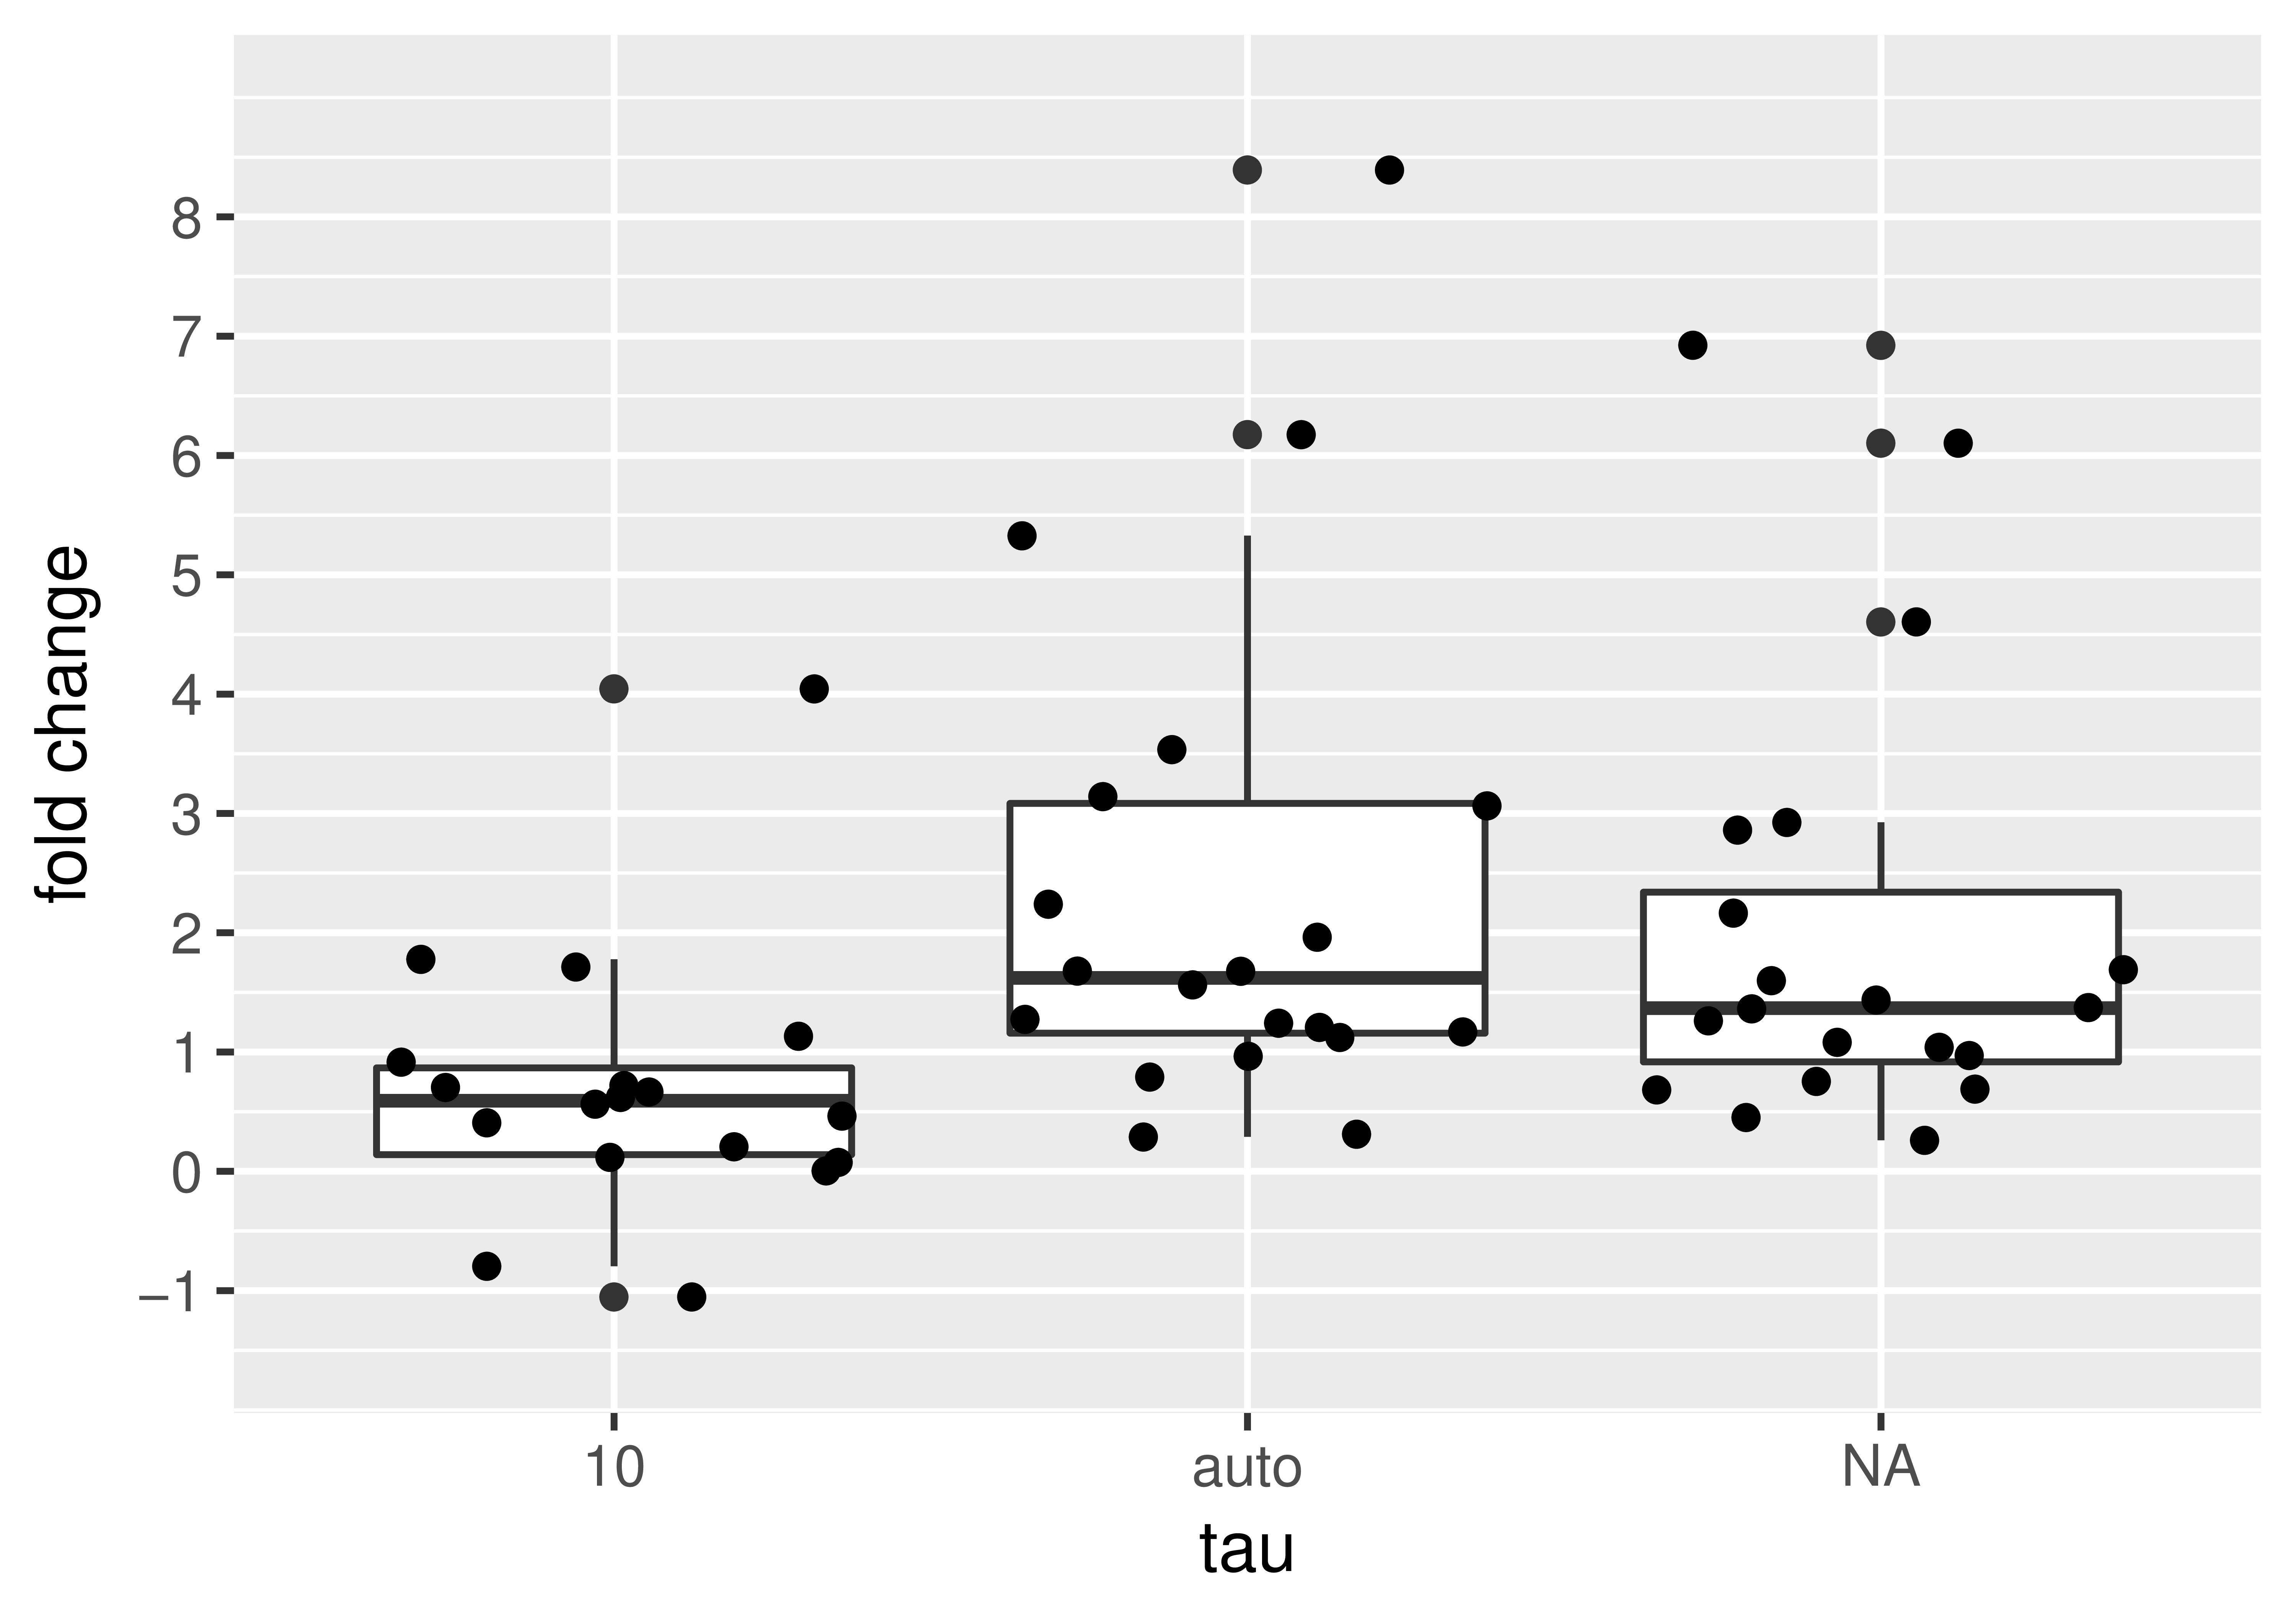
Figure 4.1: The fold changes in brightness \(\epsilon\) upon addition of AP1510 drug shown for different detrending routines (\(\tau=10\), auto \(\tau\) and no detrend).
A pair of cells from this study together with their brightness statistics are shown in figure 4.2. Notice how there is no discernible change in intensity before and after addition of the drug, but there is a discernible change in brightness \(B\), best seen using the histogram of pixel brightnesses.
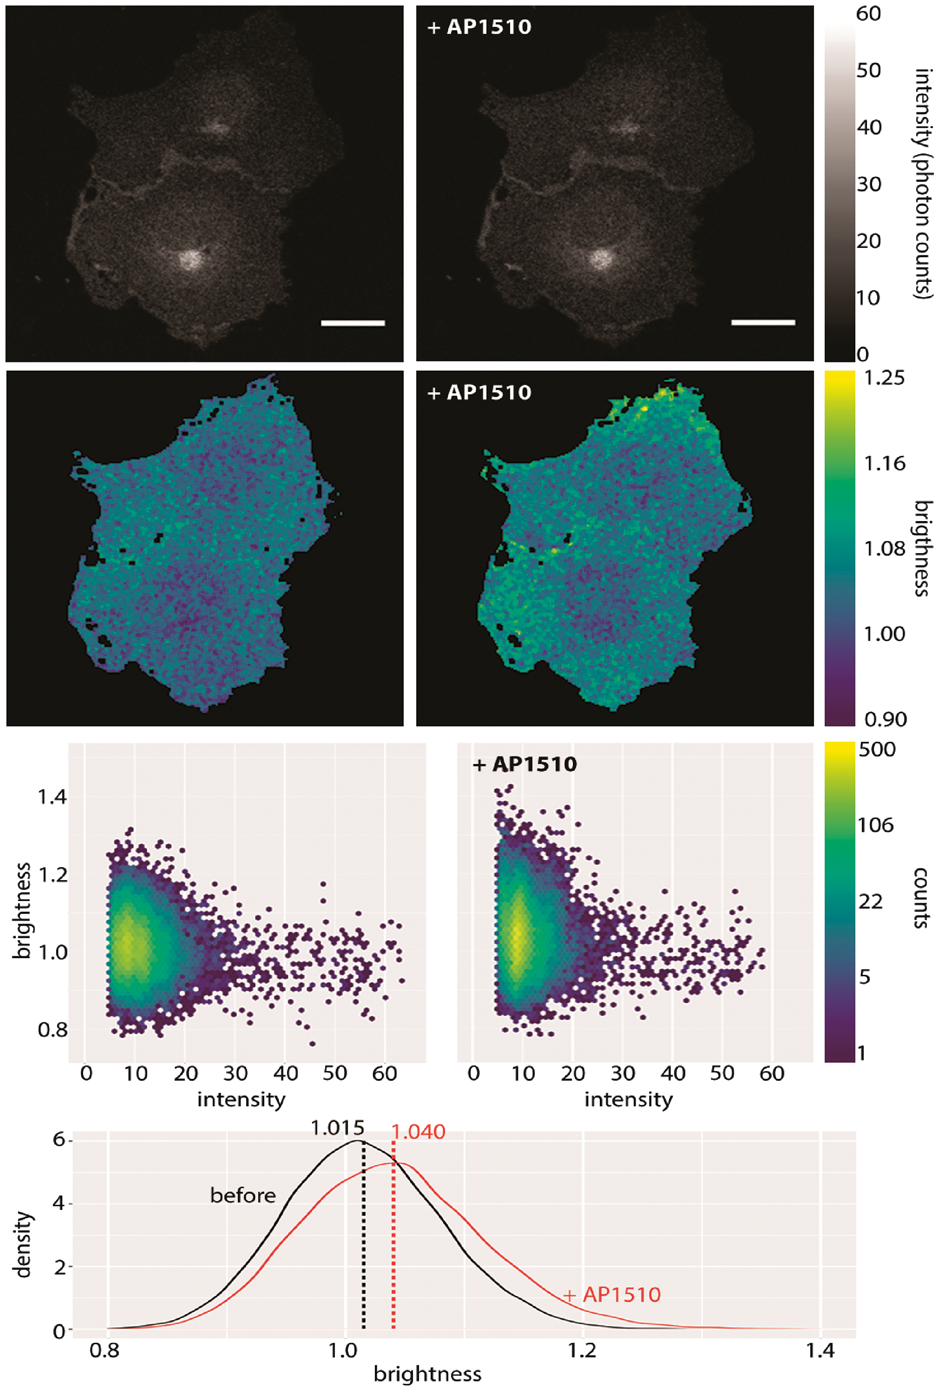
Figure 4.2: mClover-labelled myristoylated FKBP12 before and after application of 50nM AP1510. Shown here are intensity (first row), brightness (second row), a plot of intensity versus brightness (third row) and brightness histograms (fourth row). Notice how the change in brightness upon addition of the drug is seen most clearly by comparing the brightness histograms. The vertical lines in the histogram plot show the means of those histograms. Brightness here refers to B. Scale bar 20 \(\mu\)m. (Nolan, Alvarez, et al. 2017)
4.2 In vitro number and brightness
4.2.1 Introduction
In our research group, we believe that the most practical quantitative method for measuring homo-dimerization in vivo and in vitro is N&B (Digman et al. 2008) because it is calibration-free and does not require specialized instrumentation. There are many examples of the application of N&B in vivo (the original N&B paper has over 250 citations, most of which are in vivo applications) but none in vitro. Hence, we published a protocol (Nolan et al. 2018) detailing how N&B can be applied in vitro. This time, we used FKBP12F36V which is an FKBP mutant with a new dimerizing drug AP20187 (known colloquially as the BB dimerizer). The fact that FKBP12F36V is an FKBP12 mutant and that BB only dimerizes this mutant means that the previous issue of the interaction of endogenous and exogenous proteins is eliminated.
4.2.2 Experimental results and discussion
In this experiment, the FKBP12F36V was labelled with mVenus. We found that the brightness doubled from \(\epsilon = 0.005\) to \(\epsilon = 0.010\) upon addition of the drug. See figure 4.3. This analysis was done with exponential smoothing detrending with automatically chosen parameter \(\tau\). Without detrending, the pre-BB brightness was calculated as \(\epsilon = 0.026\), whereas the post-BB brightness was calculated as \(\epsilon = 0.010\) again, which would lead one to conclude that the oligomeric state decreased upon BB addition. This is a nonsensical result given that the FKBP12F36V is monomeric to begin with. This shows that detrending is absolutely necessary and that neglecting this step can lead to incorrect results.
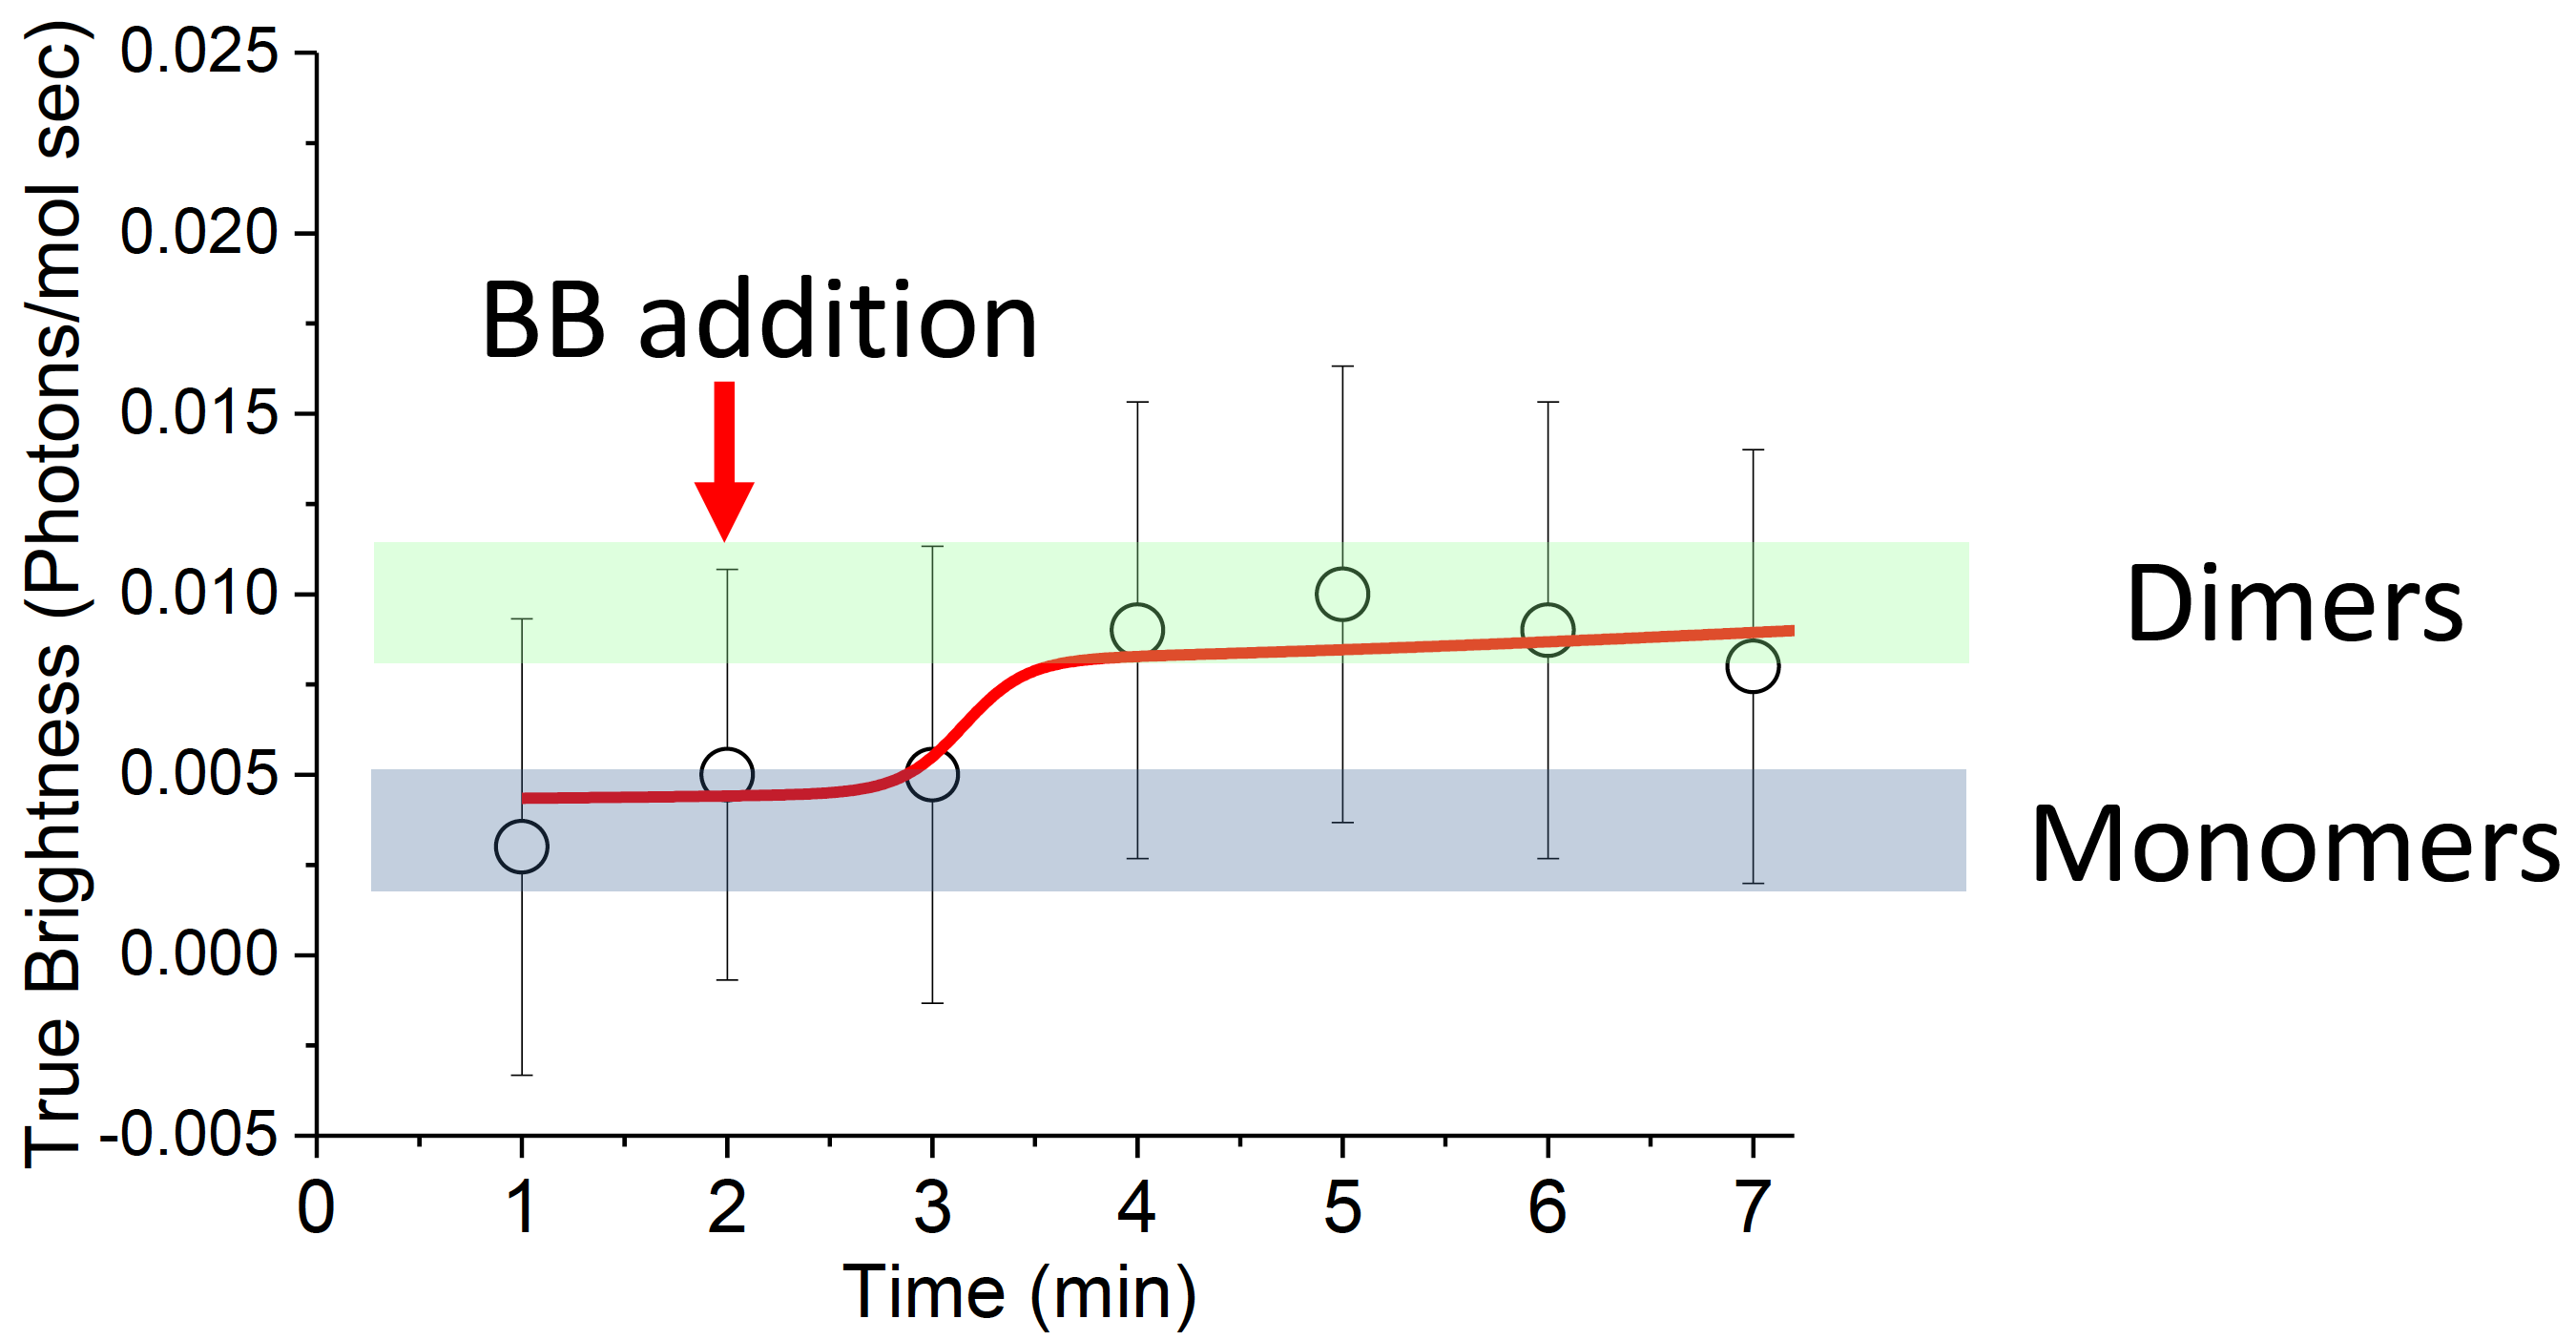
Figure 4.3: Dimerization of FKBP12F36V upon BB addition is seen by a brightness doubling from \(\epsilon = 0.005\) to \(\epsilon = 0.010\) over a period of minutes.
Remark. This paper also included an important correction to the equation for brightness \(\epsilon\) when analog equipment is used. The correct equation is
\[\begin{equation} \epsilon = \frac{\sigma^2 - \sigma_0^2}{S(\langle I \rangle - \text{ offset})} - 1 \tag{4.1} \end{equation}\] The \(S\) in the denominator was omitted in the original paper (Dalal et al. 2008) and this error was reproduced in our N&B review (Nolan, Iliopoulou, et al. 2017).4.3 HIV-1 receptor stoichiometry
4.3.1 Introduction
4.3.1.1 HIV-1 cell entry
HIV-1 infects many cell types (e.g. CD4 T cells, macrophages, dendritic cells) and has different modes of entry for each cell type and indeed possibly more than one mode of entry in any given cell type (Jakobsdottir et al. 2017). Endocytosis is thought to be a common entry route (Miyauchi et al. 2009), particularly in macrophages (Marechal et al. 2001) and Dendritic cells (Ménager and Littman 2016). In CD4 T cells, HIV-1 has been shown to fuse at the plasma membrane without needing endocytosis (Herold et al. 2014).
Entry of HIV into any cell involves the initial binding of the CD4 receptor on that cell by the HIV-1 virus. Subsequently, a co-receptor (often CCR5 or CXCR4) is used in the fusion process (Jakobsdottir et al. 2017). The question of how many receptors and co-receptors are required to facilitate fusion (the stoichiometry of the interaction of HIV-1 with its receptor and co-receptor—possibly different for different cell types) had not been answered.
4.3.1.2 The use of number and brightness to study HIV-1 cell entry
Our main motivation for studying N&B in the first place was that we thought it was a valuable method to study the process of HIV-1 fusion in live cells. N&B was first used in our research group to study the oligomeric state of dynamin at the HIV-1 fusion pore in TZM-bl cells (Jones et al. 2017). This study concluded that dynamin-2 stabilizes the HIV-1 fusion pore with a low oligomeric state.
Following on from this, we wanted to study the stoichiometry of the interaction of HIV-1 with its receptor (CD4) and co-receptor (CCR5 or CXCR4) upon the engagement of the virus with the cell and to follow this interaction stoichiometry up to the point of fusion; see figure 4.4.
Entry of HIV-1 into a host cell requires an initial interaction between the viral-envelope glycoprotein spike complex—Env—with cell surface displayed CD4 and co receptors (Jakobsdottir et al. 2017). Although structural studies have revealed the intra-molecular basis for CD4 receptor and CXCR4/CCR5 co-receptor-induced conformational changes to the HIV-1 Env during host cell entry (Ozorowski et al. 2017), little is known about how the inter-molecular dynamics and stoichiometry of this process culminates in fusion with the host cell membrane in live cells (Brandenberg et al. 2015). This is due to the difficulty of working with live cells and the lack of temporal resolution of the techniques commonly employed (i.e. crystallography and cryo-EM).
— Iliopoulou et al. (2018)
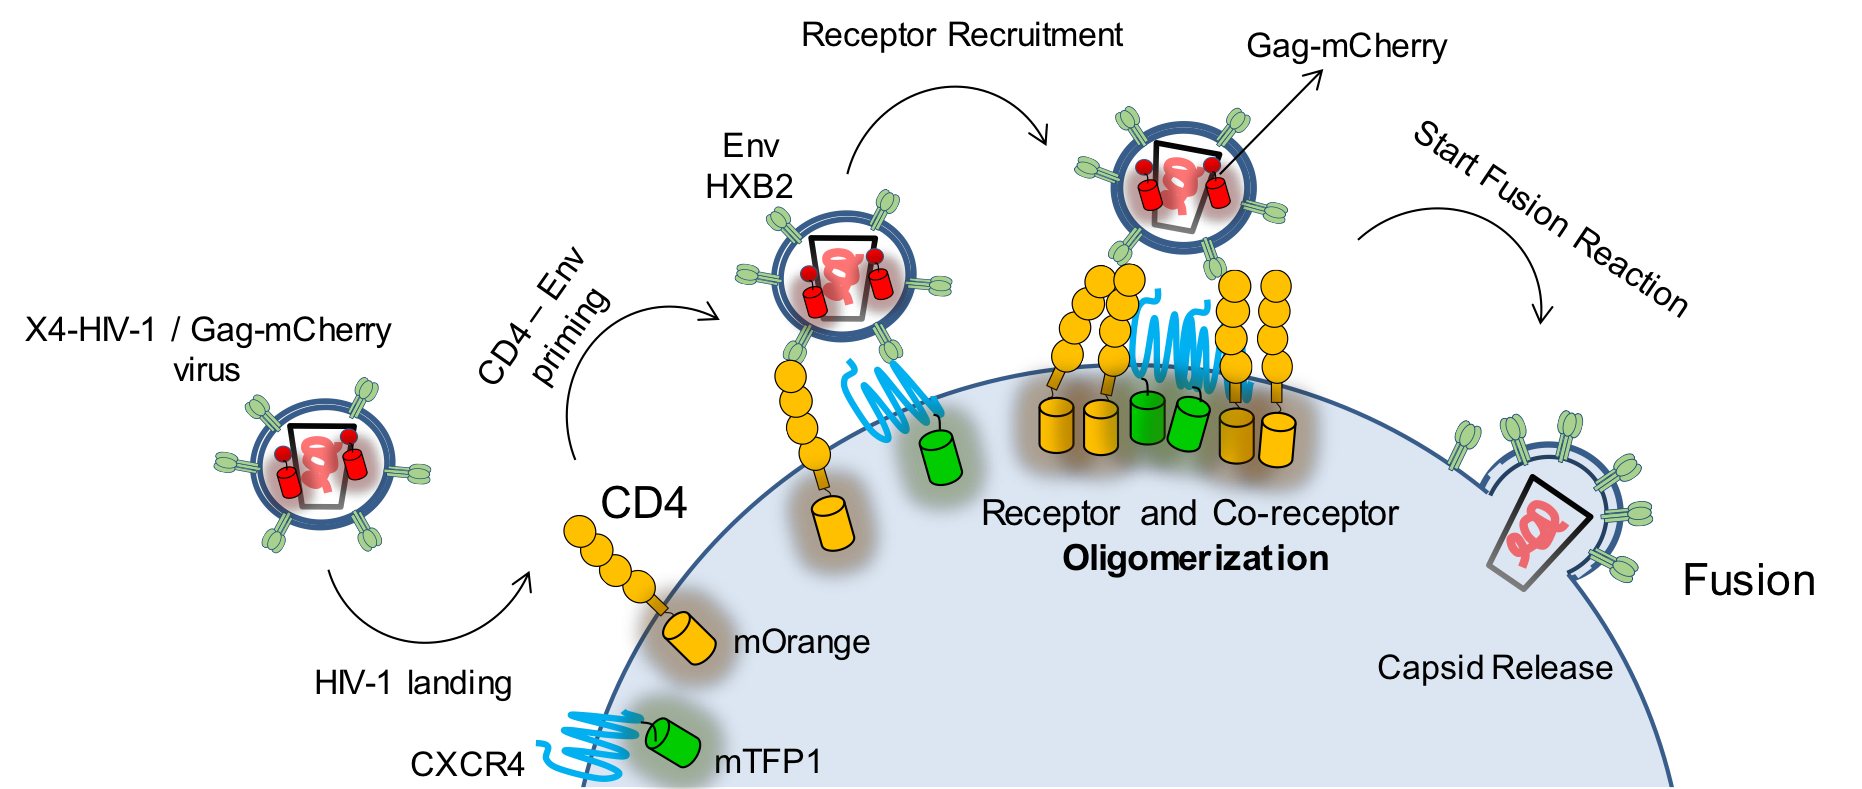
Figure 4.4: The HIV-1 envelope glycoprotein Env must bind the receptor (CD4) and form a complex with the co-receptor (CXCR4 or CCR5, this figure shows an X4-tropic virus and co-receptor) to initiate the fusion process. Labeling the viral Gag protein with mCherry, the receptor with mTFP1 and the co-receptor with mOrange, it is possible to follow these three players in the fusion reaction and to quantify their interaction.
We saw N&B as the ideal technique to probe this stoichiometry temporally. With our microscope, we could acquire 100 frames per 1.7 minutes, therefore, using each consecutive sequence of 100 frames to create a brightness image, we could obtain 1 brightness image every 1.7 minutes and use this to calculate this temporal stoichiometry.
4.3.2 Experimental setup
Cos7 cells were transfected with labelled receptor (CD4) and co-receptor (CXCR4 or CCR5) (these cells do not express these proteins endogenously). Virus was added at time \(t=0\) and imaging proceeded for a number of minutes at 100 frames per 1.7 minutes. Alternating laser excitation (ALEX, Kapanidis et al. (2005)) was used to eliminate the possibility of channel bleed-through. See figure 4.5.
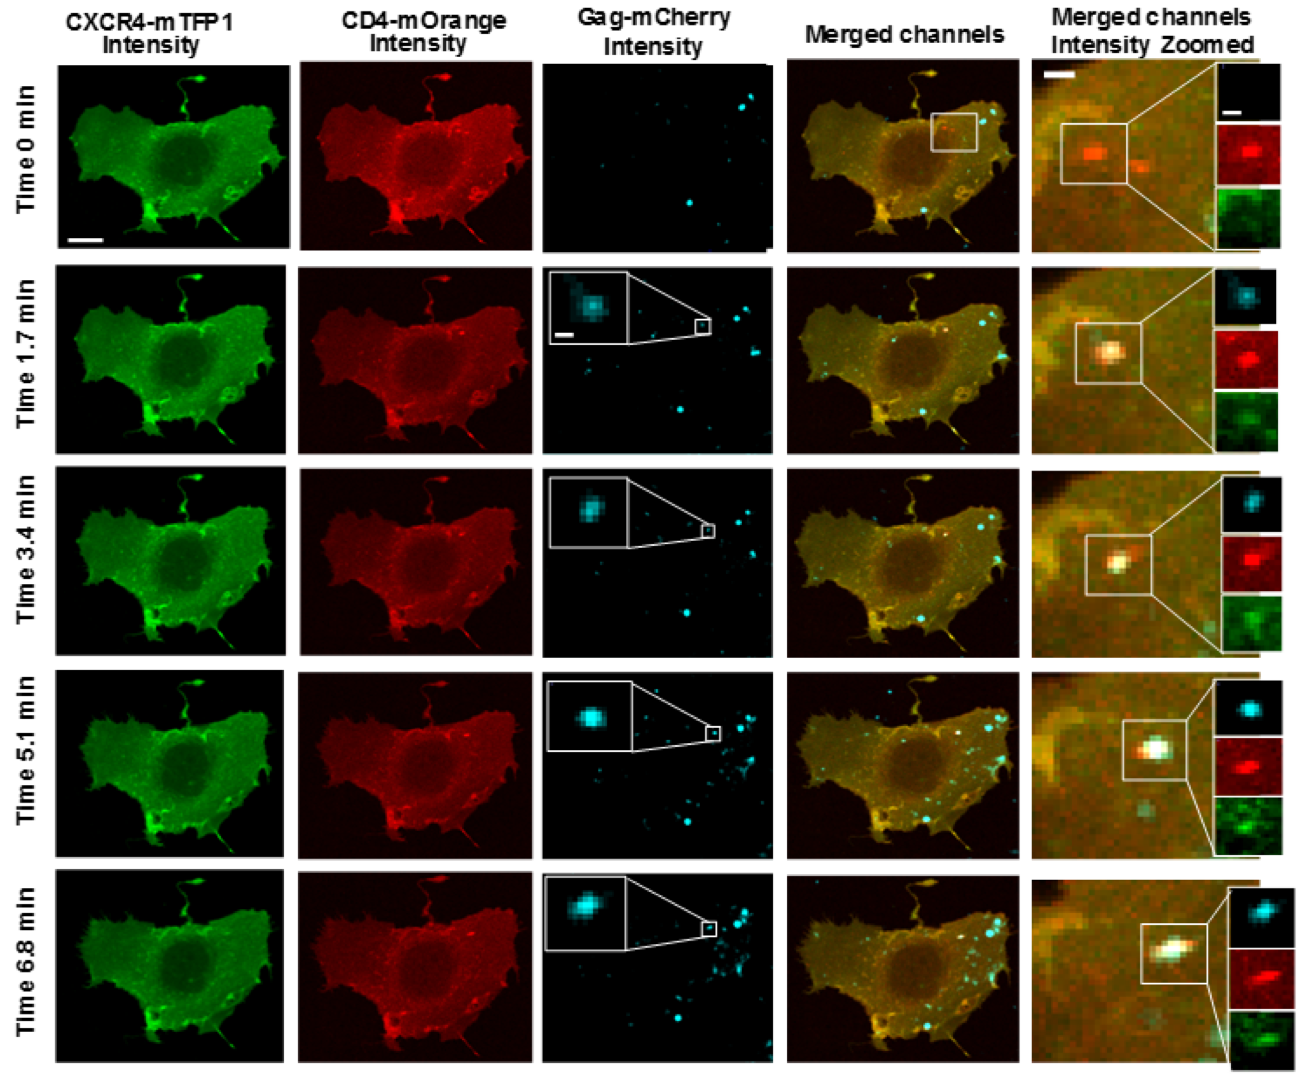
Figure 4.5: Intensity images from the virus, receptor and co-receptor. Every 100th frame is shown. A virus which lands at \(t \approx 1.7\) minutes is highlighted.
4.3.3 Analysis
The virus channel was used to locate the virus at a given point in time. The receptor and co-receptor were used to calculate brightness and cross-correlated brightness every 100 frames (every 1.7 min). The brightness was used to determine the number of receptor and co-receptor units involved in a complex. The cross-correlated brightness was used to delimit whether or not the receptor and co-receptor units were together in the same complex. See figure 4.6, this is the corresponding brightness and cross-correlated brightness image of figure 4.5. Notice that once the virus lands, the oligomeric state of the receptor and co-receptor increases. We also see significant positive cross-correlated brightness in this area, indicating that the virus has triggered a complex of receptor and co-receptor.
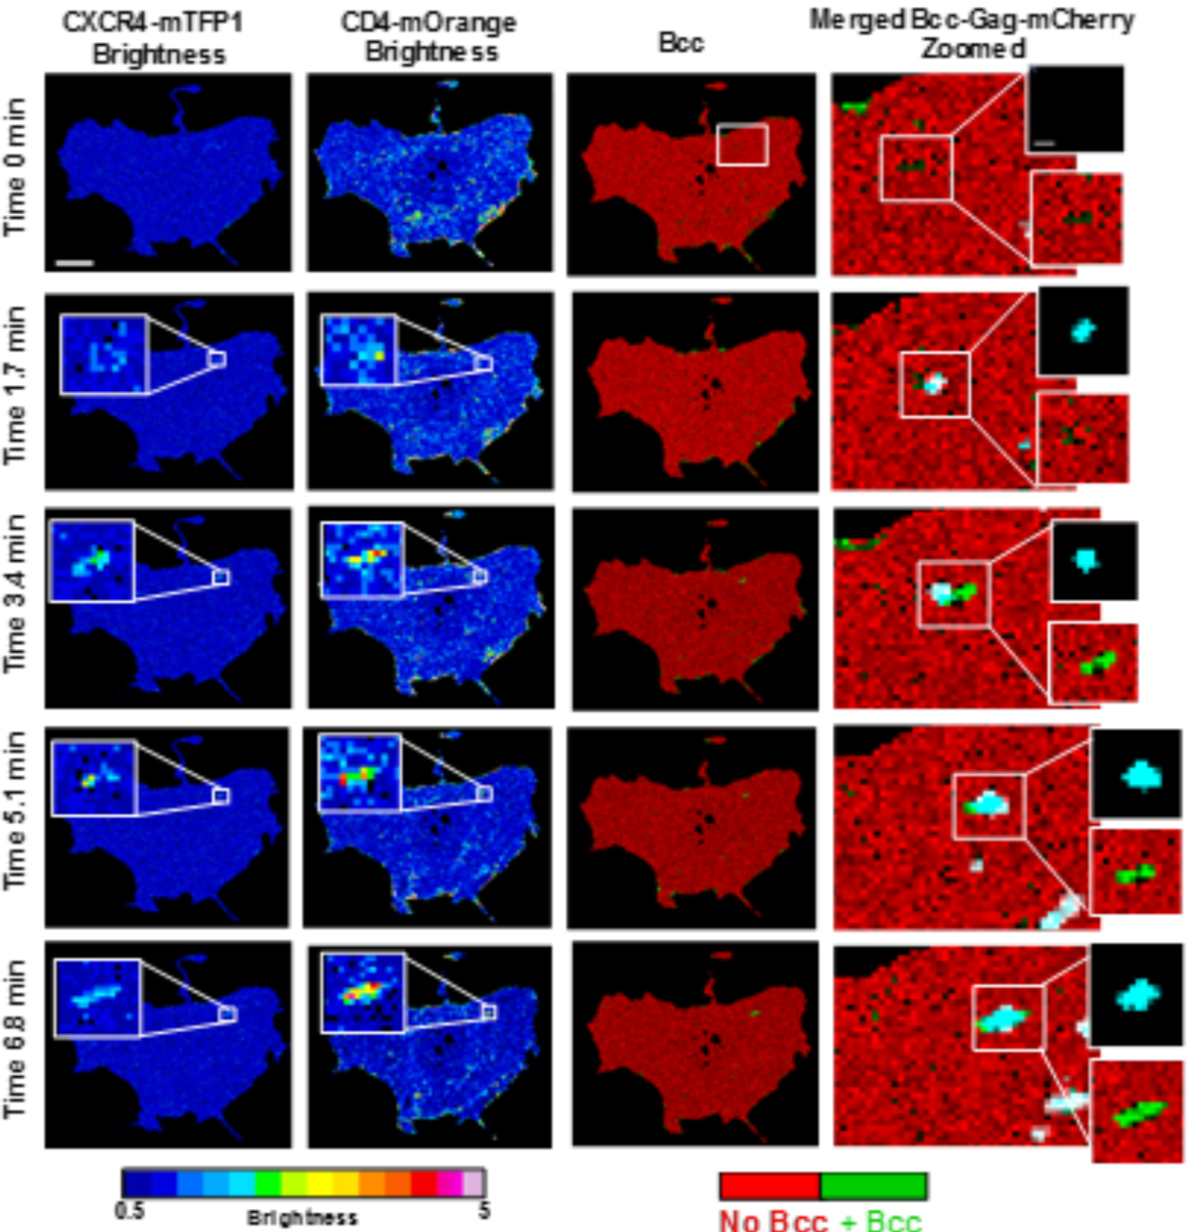
Figure 4.6: Brightness images of receptor and co-receptor and cross-correlated brightness image of the interaction between the two.
4.3.4 Results
Figure 4.7 shows the results of the analysis detailed in figures 4.5 and 4.6 for \(n=10\) cases where virus triggered receptor and co-receptor complexes in the X4-tropic setting and \(n=12\) in the R5-tropic setting. A three-step pre-fusion process is hypothesized for each.
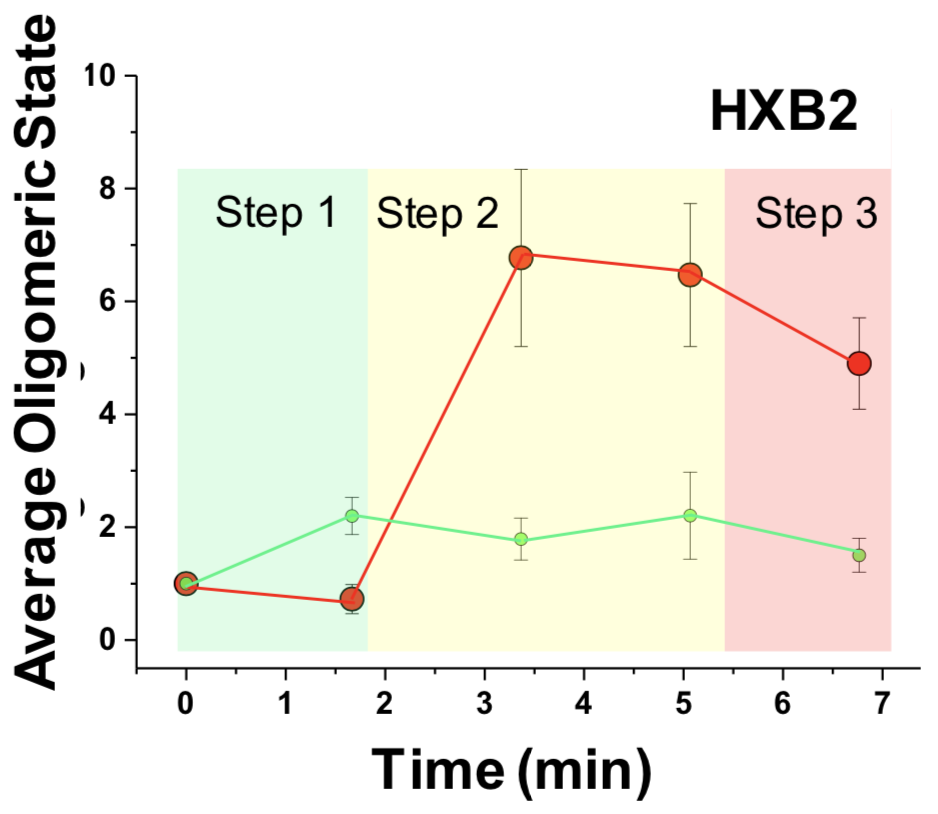
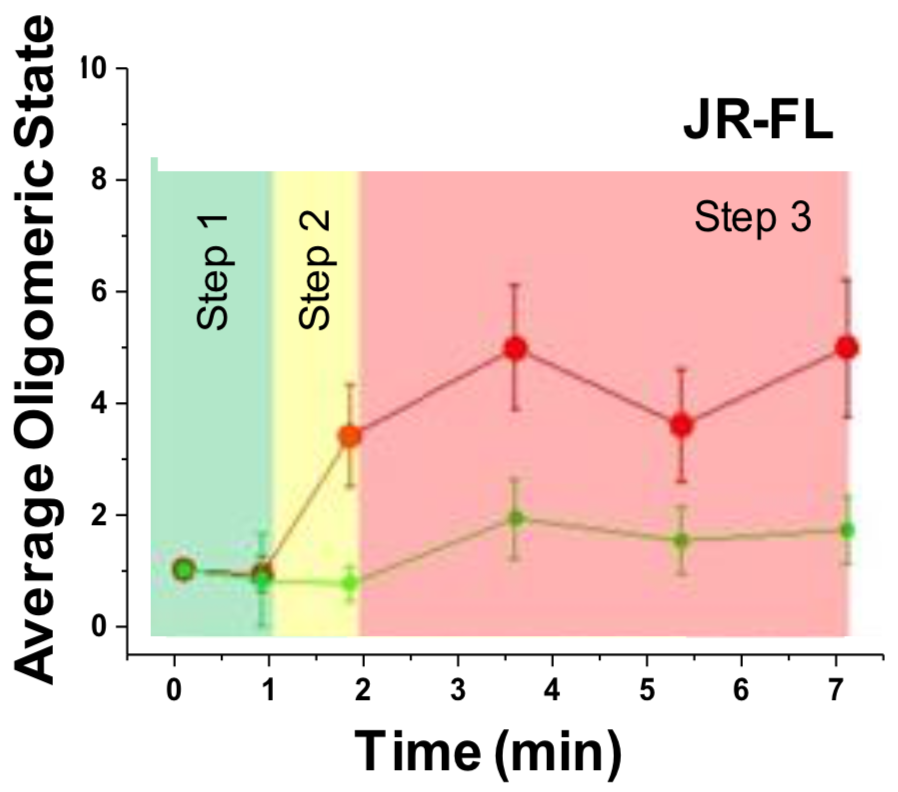
Figure 4.7: Number of receptor and co-receptor units involved in complexes with virus over time, obtained by brightness analysis. Left panel: HIVHXB2. Right panel: HIVJR-FL.
Our studies support a dynamic three step model for both HIVHXB2 and HIVJR-FL (figure 4.8). For X4 tropic virions, Env – CD4 interactions induce CXCR4 dimerization, CD4 then engages with two Env (shown by 3 color TIRF-dSTORM microscopy) to generate a hexamer that might serve as a scaffold to stabilise a final 4 CD4 – 1/2 CXCR4 conformation, with a single Env. We speculate that for HIVHXB2, step 2 is crucial to culminate the fusion reaction and there could be an anchoring domain and a fusion domain that undergoes gp120 disassembly leading to 6 helix bundle formation. For R5-tropic virions, Env – CD4 interactions form the previously described asymmetric pre-hairpin intermediate (Munro et al. 2014) (Kwon et al. 2015) (Ma et al. 2018), following binding and oligomerisation of 2 additional CD4 molecules with concomitant CCR5 dimerization. After this, the secondary intermediate leads to the final fusion competent complex with a total of \(4\pm 0.3\) CD4, \(2\pm 0.3\) CCR5 and 1 JR-FL Env. Interestingly, dSTORM experiments show an average stoichiometry for step 3 of \(3.4\pm 0.1\) CD4, \(1.5\pm 0.2\) CCR5.
Our data indicate that both HXB2 Env and JR-FL Env start with an asymmetric intermediate bound to a single CD4, as previously suggested. Our models also support the existence of important differences in the entry mechanisms of X4 and R5 strains. In the X4 strains, CXCR4 dimerization (Tan et al. 2013) (Qin et al. 2015) occurs prior to CD4 hexamer formation and following initial Env – CD4 recognition (Liu et al. 2017). For R5 tropic JR-FL, CCR5 dimerization (Qin et al. 2015) occurs after Env-CD4 complexation and recruitment of two additional CD4 molecules (Wu et al. 1996) around the complex.
— Iliopoulou et al. (2018)
For the X4 and R5-tropic cases, structural modelling of the hypothesis has been done to visualize our findings and to assess their viability; this produced figure 4.8.
Figure 4.8: Model of pre-fusion reaction sequences for the R5 (a) and X4 (b) tropic cases.
4.3.5 Conclusion
Time-resolved N&B enabled us to answer questions about the interaction between HIV-1 and its receptor and co-receptor in live cells which up to now could not be answered. We addressed this problem with the N&B technique. Successful application of N&B relies on being able to correct for bleaching reliably (as seen in section 4.2). This was impossible before the advent of my bleaching correction algorithms, therefore their development was a key step in making this work possible.
References
Amara, J. F., T. Clackson, V. M. Rivera, T. Guo, T. Keenan, S. Natesan, R. Pollock, et al. 1997. “A Versatile Synthetic Dimerizer for the Regulation of Protein-Protein Interactions.” Proceedings of the National Academy of Sciences 94 (20): 10618–23. doi:10.1073/pnas.94.20.10618.
Brandenberg, Oliver F., Carsten Magnus, Roland R. Regoes, and Alexandra Trkola. 2015. “The HIV-1 Entry Process: A Stoichiometric View.” Trends in Microbiology 23 (12). Elsevier BV: 763–74. doi:10.1016/j.tim.2015.09.003.
Dalal, R. B., M. A. Digman, A. F. Horwitz, V. Vetri, and E. Gratton. 2008. “Determination of particle number and brightness using a laser scanning confocal microscope operating in the analog mode.” Microsc. Res. Tech. 71 (1): 69–81. doi:10.1002/jemt.20526.
Digman, M. A., R. Dalal, A. F. Horwitz, and E. Gratton. 2008. “Mapping the number of molecules and brightness in the laser scanning microscope.” Biophys. J. 94 (6): 2320–32. doi:10.1529/biophysj.107.114645.
Dunsing, Valentin, Madlen Luckner, Boris Zühlke, Roberto Petazzi, Andreas Herrmann, and Salvatore Chiantia. 2018. “Quantifying Protein Oligomerization in Living Cells: A Systematic Comparison of Fluorescent Proteins,” April. Cold Spring Harbor Laboratory. doi:10.1101/311175.
Herold, N., M. Anders-Osswein, B. Glass, M. Eckhardt, B. Muller, and H.-G. Krausslich. 2014. “HIV-1 Entry in SupT1-R5, CEM-Ss, and Primary CD4 T Cells Occurs at the Plasma Membrane and Does Not Require Endocytosis.” Journal of Virology 88 (24). American Society for Microbiology: 13956–70. doi:10.1128/jvi.01543-14.
Iliopoulou, Maro, Rory Nolan, Luis Alvarez, Yasunori Watanabe, Charles A. Coomer, G. Maria Jakobsdottir, Thomas A. Bowden, and Sergi Padilla-Parra. 2018. “A dynamic three step mechanism drives the HIV-1 prefusion reaction.” Nat. Struct. Mol. Biol. 25 (9). doi:10.1038/s41594-018-0113-x.
Jakobsdottir, G. Maria, Maro Iliopoulou, Rory Nolan, Luis Alvarez, Alex A. Compton, and Sergi Padilla-Parra. 2017. “On the Whereabouts of HIV-1 Cellular Entry and Its Fusion Ports.” Trends in Molecular Medicine 23 (10). Elsevier BV: 932–44. doi:10.1016/j.molmed.2017.08.005.
Jones, Daniel M, Luis A Alvarez, Rory Nolan, Margarita Ferriz, Raquel Sainz Urruela, Xènia Massana-Muñoz, Hila Novak-Kotzer, Michael L Dustin, and Sergi Padilla-Parra. 2017. “Dynamin-2 Stabilizes the Hiv-1 Fusion Pore with a Low Oligomeric State.” Cell Reports 18 (2). Elsevier: 443–53. doi:10.1016/j.celrep.2016.12.032.
Kapanidis, Achillefs N., Ted A. Laurence, Nam Ki Lee, Emmanuel Margeat, Xiangxu Kong, and Shimon Weiss. 2005. “Alternating-Laser Excitation of Single Molecules.” Accounts of Chemical Research 38 (7). American Chemical Society (ACS): 523–33. doi:10.1021/ar0401348.
Kwon, Young Do, Marie Pancera, Priyamvada Acharya, Ivelin S Georgiev, Emma T Crooks, Jason Gorman, M Gordon Joyce, et al. 2015. “Crystal Structure, Conformational Fixation and Entry-Related Interactions of Mature Ligand-Free HIV-1 Env.” Nature Structural & Molecular Biology 22 (7). Springer Nature: 522–31. doi:10.1038/nsmb.3051.
Liu, Qingbo, Priyamvada Acharya, Michael A Dolan, Peng Zhang, Christina Guzzo, Jacky Lu, Alice Kwon, et al. 2017. “Quaternary Contact in the Initial Interaction of CD4 with the HIV-1 Envelope Trimer.” Nature Structural & Molecular Biology 24 (4). Springer Nature: 370–78. doi:10.1038/nsmb.3382.
Ma, Xiaochu, Maolin Lu, Jason Gorman, Daniel S Terry, Xinyu Hong, Zhou Zhou, Hong Zhao, et al. 2018. “HIV-1 Env Trimer Opens Through an Asymmetric Intermediate in Which Individual Protomers Adopt Distinct Conformations.” eLife 7 (March). eLife Sciences Organisation, Ltd. doi:10.7554/elife.34271.
Marechal, V., M.-C. Prevost, C. Petit, E. Perret, J.-M. Heard, and O. Schwartz. 2001. “Human Immunodeficiency Virus Type 1 Entry into Macrophages Mediated by Macropinocytosis.” Journal of Virology 75 (22). American Society for Microbiology: 11166–77. doi:10.1128/jvi.75.22.11166-11177.2001.
Ménager, Mickaël M., and Dan R. Littman. 2016. “Actin Dynamics Regulates Dendritic Cell-Mediated Transfer of HIV-1 to T Cells.” Cell 164 (4). Elsevier BV: 695–709. doi:10.1016/j.cell.2015.12.036.
Miyauchi, Kosuke, Yuri Kim, Olga Latinovic, Vladimir Morozov, and Gregory B. Melikyan. 2009. “HIV Enters Cells via Endocytosis and Dynamin-Dependent Fusion with Endosomes.” Cell 137 (3). Elsevier BV: 433–44. doi:10.1016/j.cell.2009.02.046.
Munro, J. B., J. Gorman, X. Ma, Z. Zhou, J. Arthos, D. R. Burton, W. C. Koff, et al. 2014. “Conformational Dynamics of Single HIV-1 Envelope Trimers on the Surface of Native Virions.” Science 346 (6210). American Association for the Advancement of Science (AAAS): 759–63. doi:10.1126/science.1254426.
Nolan, Rory, L Alvarez, Jonathan Elegheert, Maro Iliopoulou, G Maria Jakobsdottir, Marina Rodriguez-Muñoz, A Radu Aricescu, and Sergi Padilla Parra. 2017. “Nandb—number and Brightness in R with a Novel Automatic Detrending Algorithm.” Bioinformatics 33 (21). Oxford University Press: 3508–10. doi:10.1093/bioinformatics/btx434.
Nolan, Rory, Luis Alvarez, Samuel C. Griffiths, Jonathan Elegheert, Christian Siebold, and Sergi Padilla-Parra. 2018. “Calibration-Free in-Vitro Quantification of Protein Homo-Oligomerization Using Commercial Instrumentation and Free, Open Source Brightness Analysis Software.” Journal of Visualized Experiments 137 (e58157). MyJove Corporation. doi:10.3791/58157.
Nolan, Rory, Maro Iliopoulou, Luis Alvarez, and Sergi Padilla-Parra. 2017. “Detecting Protein Aggregation and Interaction in Live Cells: A Guide to Number and Brightness.” Methods. doi:10.1016/j.ymeth.2017.12.001.
Ozorowski, Gabriel, Jesper Pallesen, Natalia de Val, Dmitry Lyumkis, Christopher A. Cottrell, Jonathan L. Torres, Jeffrey Copps, et al. 2017. “Open and Closed Structures Reveal Allostery and Pliability in the HIV-1 Envelope Spike.” Nature 547 (7663). Springer Nature: 360–63. doi:10.1038/nature23010.
Qin, L., I. Kufareva, L. G. Holden, C. Wang, Y. Zheng, C. Zhao, G. Fenalti, et al. 2015. “Crystal Structure of the Chemokine Receptor CXCR4 in Complex with a Viral Chemokine.” Science 347 (6226). American Association for the Advancement of Science (AAAS): 1117–22. doi:10.1126/science.1261064.
Tan, Q., Y. Zhu, J. Li, Z. Chen, G. W. Han, I. Kufareva, T. Li, et al. 2013. “Structure of the CCR5 Chemokine Receptor-HIV Entry Inhibitor Maraviroc Complex.” Science 341 (6152). American Association for the Advancement of Science (AAAS): 1387–90. doi:10.1126/science.1241475.
Wu, Lijun, Norma P. Gerard, Richard Wyatt, Hyeryun Choe, Cristina Parolin, Nancy Ruffing, Alessândra Borsetti, et al. 1996. “CD4-Induced Interaction of Primary HIV-1 Gp120 Glycoproteins with the Chemokine Receptor CCR-5.” Nature 384 (6605). Springer Nature: 179–83. doi:10.1038/384179a0.